My Biomarkers on an e-Ink Display
Last year, I built myself an e-Ink Dashboard for my desk and multiple people have asked me how they can get one too. So I'm finally sharing how I built it.
You can use this post as entertainment or if you're technically knowledgeable, as inspiration for your own version.
Why e-ink
I've been a fan of e-ink technology for a while now. The thing I love most about it is that it doesn't feel like technology. It can feel like a picture hanging on your wall, or a note sitting on your desk. There's no glow, no distraction. It just blends in.
The technical reason is equally satisfying: e-ink only uses energy when the pixels actually change. Once the image is set, it draws nothing. That means a battery that lasts months, not hours.
Over the past two years, the e-ink space has gained a lot of traction, especially through projects like TRMNL (referral link, I get store credit). And I've been nerding out about it ever since.
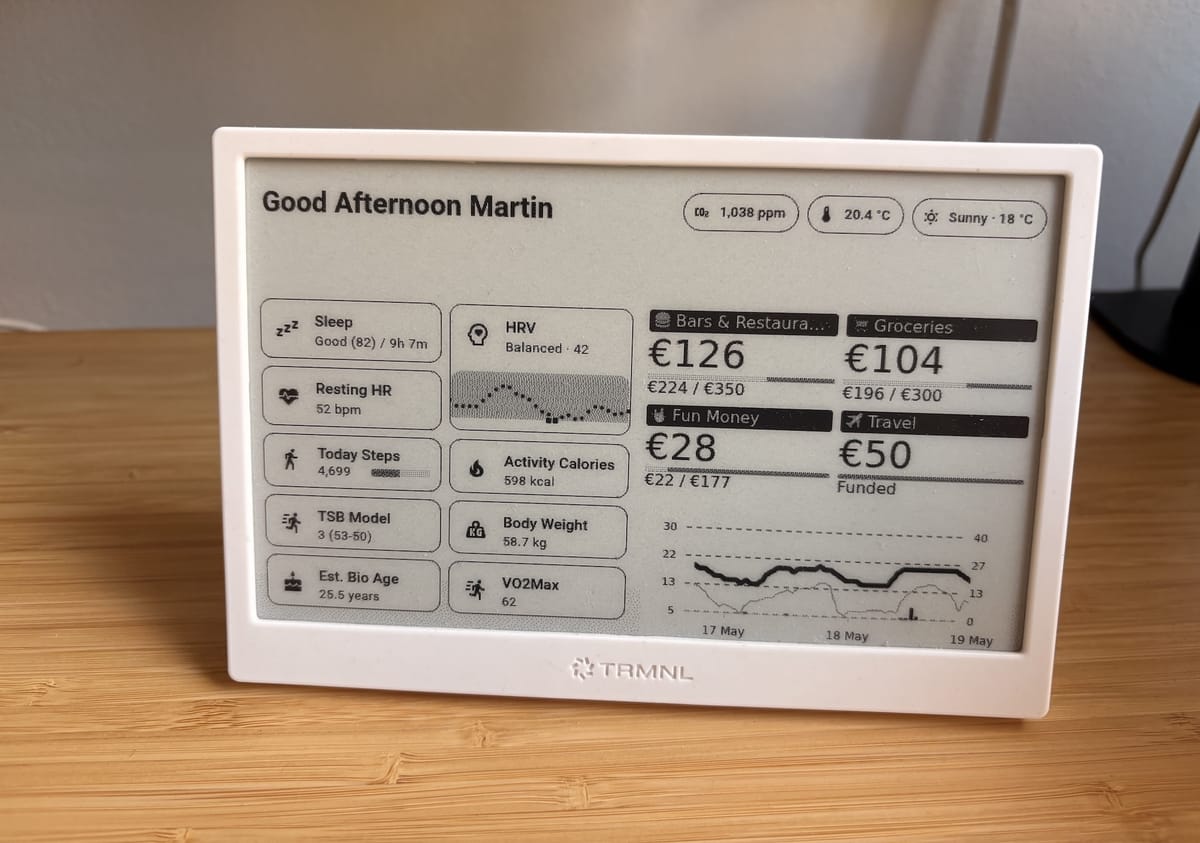
I currently have two displays. One sits on my desk, the other one is on the fridge. They show different things depending on context: biomarkers, my monthly budget, rain forecast, CO₂ levels inside the room, temperature inside and outside, and a few other things. A lot of this is conditional, so the display adapts based on what's relevant at the time.
But the part that gets the most attention, and the focus of this post, is the biomarkers.
What I'm tracking (and why)
I'm an endurance athlete, and I'm also just generally into understanding how my body responds to training, food, sleep, and stress. So I collect a bunch of data from my smartwatch and put the most relevant numbers right in front of me, every day.
Here's what's on the display:
- Resting Heart Rate: Strong indicator of recovery and overall cardiovascular health. If my resting heart rate suddenly goes up, something is off. Could be stress, poor sleep, illness, or overtraining
- HRV (Heart Rate Variability): I show a small history alongside my current baseline. HRV gives me a sense of how well my body is recovering. A consistently low HRV usually means I need to back off from training, manage stress better, or look at my sleep
- Sleep: Sleep is probably the single most important thing you can do for your body. I like that I don't see the sleep score right away when waking up, so I can first listen in on my body. But eventually, when I'm at my desk, I will see the amount of hours I slept
- Active Calories: This one is important for me specifically. I run and occasionally bike a lot, and I need to make sure I'm eating enough to compensate. If I see that I burned 1,200 active calories through activities and only ate a light lunch, I know I need to catch up. It helps me maintain my weight instead of accidentally dropping
- Weight Closely related to the above
- VO₂ Max: Fitness indicator that I enjoy watching over time. It's not something that changes day to day, but seeing it on a daily basis is motivating
- Step Goal: Fun fact: I have an almost four-year daily streak of 10,000+ steps every single day. I'm a bit obsessed about this and I'm not going to pretend I'm not 😄
- Est. Bio Age: This comes directly from Garmin and takes into account multiple factors
- TSB Model (Training Stress Balance): This is the nerdiest one on the list. TSB is a calculated number that tells me where I am in terms of building, peaking, maintaining etc. If you're a runner or cyclist and you're not familiar with TSB, it's similar to what you'd see on TrainingPeaks. I'm using intervals.icu for that (great API, more on that below)
Reminder to myself: I also want to add my average overnight respiration rate displayed in the future. Great metric to understand stress and recovery. Apparently it can catch incoming seasonal colds faster than HRV, can't wait to confirm/reject that claim.
How it works
If you've read my post on my smart home setup (check it out here), you already know the foundation: Home Assistant.
Home Assistant is the central place where I gather all my home and body-related data. Everything flows through it. My scale pushes weight data there, my sensors push air quality data, and my smartwatch data arrives there too.
For the watch data, I'm using a Garmin* and a Home Assistant integration that pulls my metrics automatically from Garmin Connect. It works well enough for this purpose, and once set up, it just runs in the background.
Some other data like the Body Weight or the TSB Model metric comes from my smart scale or intervals.icu.
From Home Assistant, I then push the relevant data to TRMNL, which renders it on the e-ink display. TRMNL has a Home Assistant plugin that makes this connection straightforward. Technically, it takes a screenshot of a Home Assistant Dashboard and sends it to the TRMNL server. If you're not comfortable with that, they also allow you to self-host the server in your own network and let you point the eInk display to it.
You don't need Garmin* for this
I'm using a Garmin watch because I switched from an Apple Watch and needed the advanced running metrics. There are other wearables out there that also provide you with that data.
But honestly, I'm not a fan of Garmin at all. I believe they're a company that systematically breaches consumer rights, at least here in Spain, and I'm currently taking legal action against them. That topic probably deserves its own blog post, but it'll be a long one, so I'll wait for the legal side to progress a bit further before writing it up. My next watch won't be a Garmin, and most people around me already know that.
A few alternatives worth knowing about:
- intervals.icu: A free platform similar to TrainingPeaks with an excellent API. You can connect almost any smartwatch to it, and then pull the data into directly into TRMNL using their Private Plugins from there. This way you can skip Home Assistant entirely. This obviously means you'll have to design your dashboard yourself but not difficult to do.
- iOS / Apple Health apps: If you're on iOS, there are apps that can read your Apple Health data and expose it via an API or push it to a service. Worth exploring if you're in the Apple ecosystem. And I'm sure an equivalent exists for Android.
- Other smartwatches: Most modern smartwatches collect similar data. The gap is usually not in the collection, but in how you get the data out. Look for APIs, open-source libraries, or community integrations.
My personal goal is to eventually go fully local and get rid of Garmin entirely. The ecosystem isn't quite there yet for running-focused smartwatches, but I'm watching this space closely and will move as soon as a solid alternative exists.
The result
What I ended up with is a quiet, paper-like display that shows me the numbers I care about most. No notifications. No glowing screen. No app I need to open. Just data, sitting there, available when I glance at it.
I look at it the same way I'd look at a silent wall clock. It doesn't demand my attention. But when I need it, it's right there.
That's the part I like the most about e-ink. It turns data into something ambient. Something that doesn't fight for your attention but is ready when you want it.
*= About the Garmin topic, I started recommending friends to check out COROS watches. I haven't seen a good way to read out their data yet, so I'll keep an eye out for that. If you're affiliated with COROS, see a private API as a way to capture customers :)